Overview

Background

Clover provides a point-of-sale ecosystem for small and medium-sized businesses, that includes hardware to ring up orders and take payments on, software that adjusts to their business need and allows the merchant to track reporting and sales on their phone or web browser, and offers an App Market where merchants can find tools that better fit their specific business needs.
Many of the apps on Clover’s App Market are built by external developers (second or third-party) and these developers decide on which apps to build and features to improve from their perspective of market demand and merchant feedback.

Clover Devices including Station, Mini, Flex, and Go cutoff midway to bottom of devices

Problem

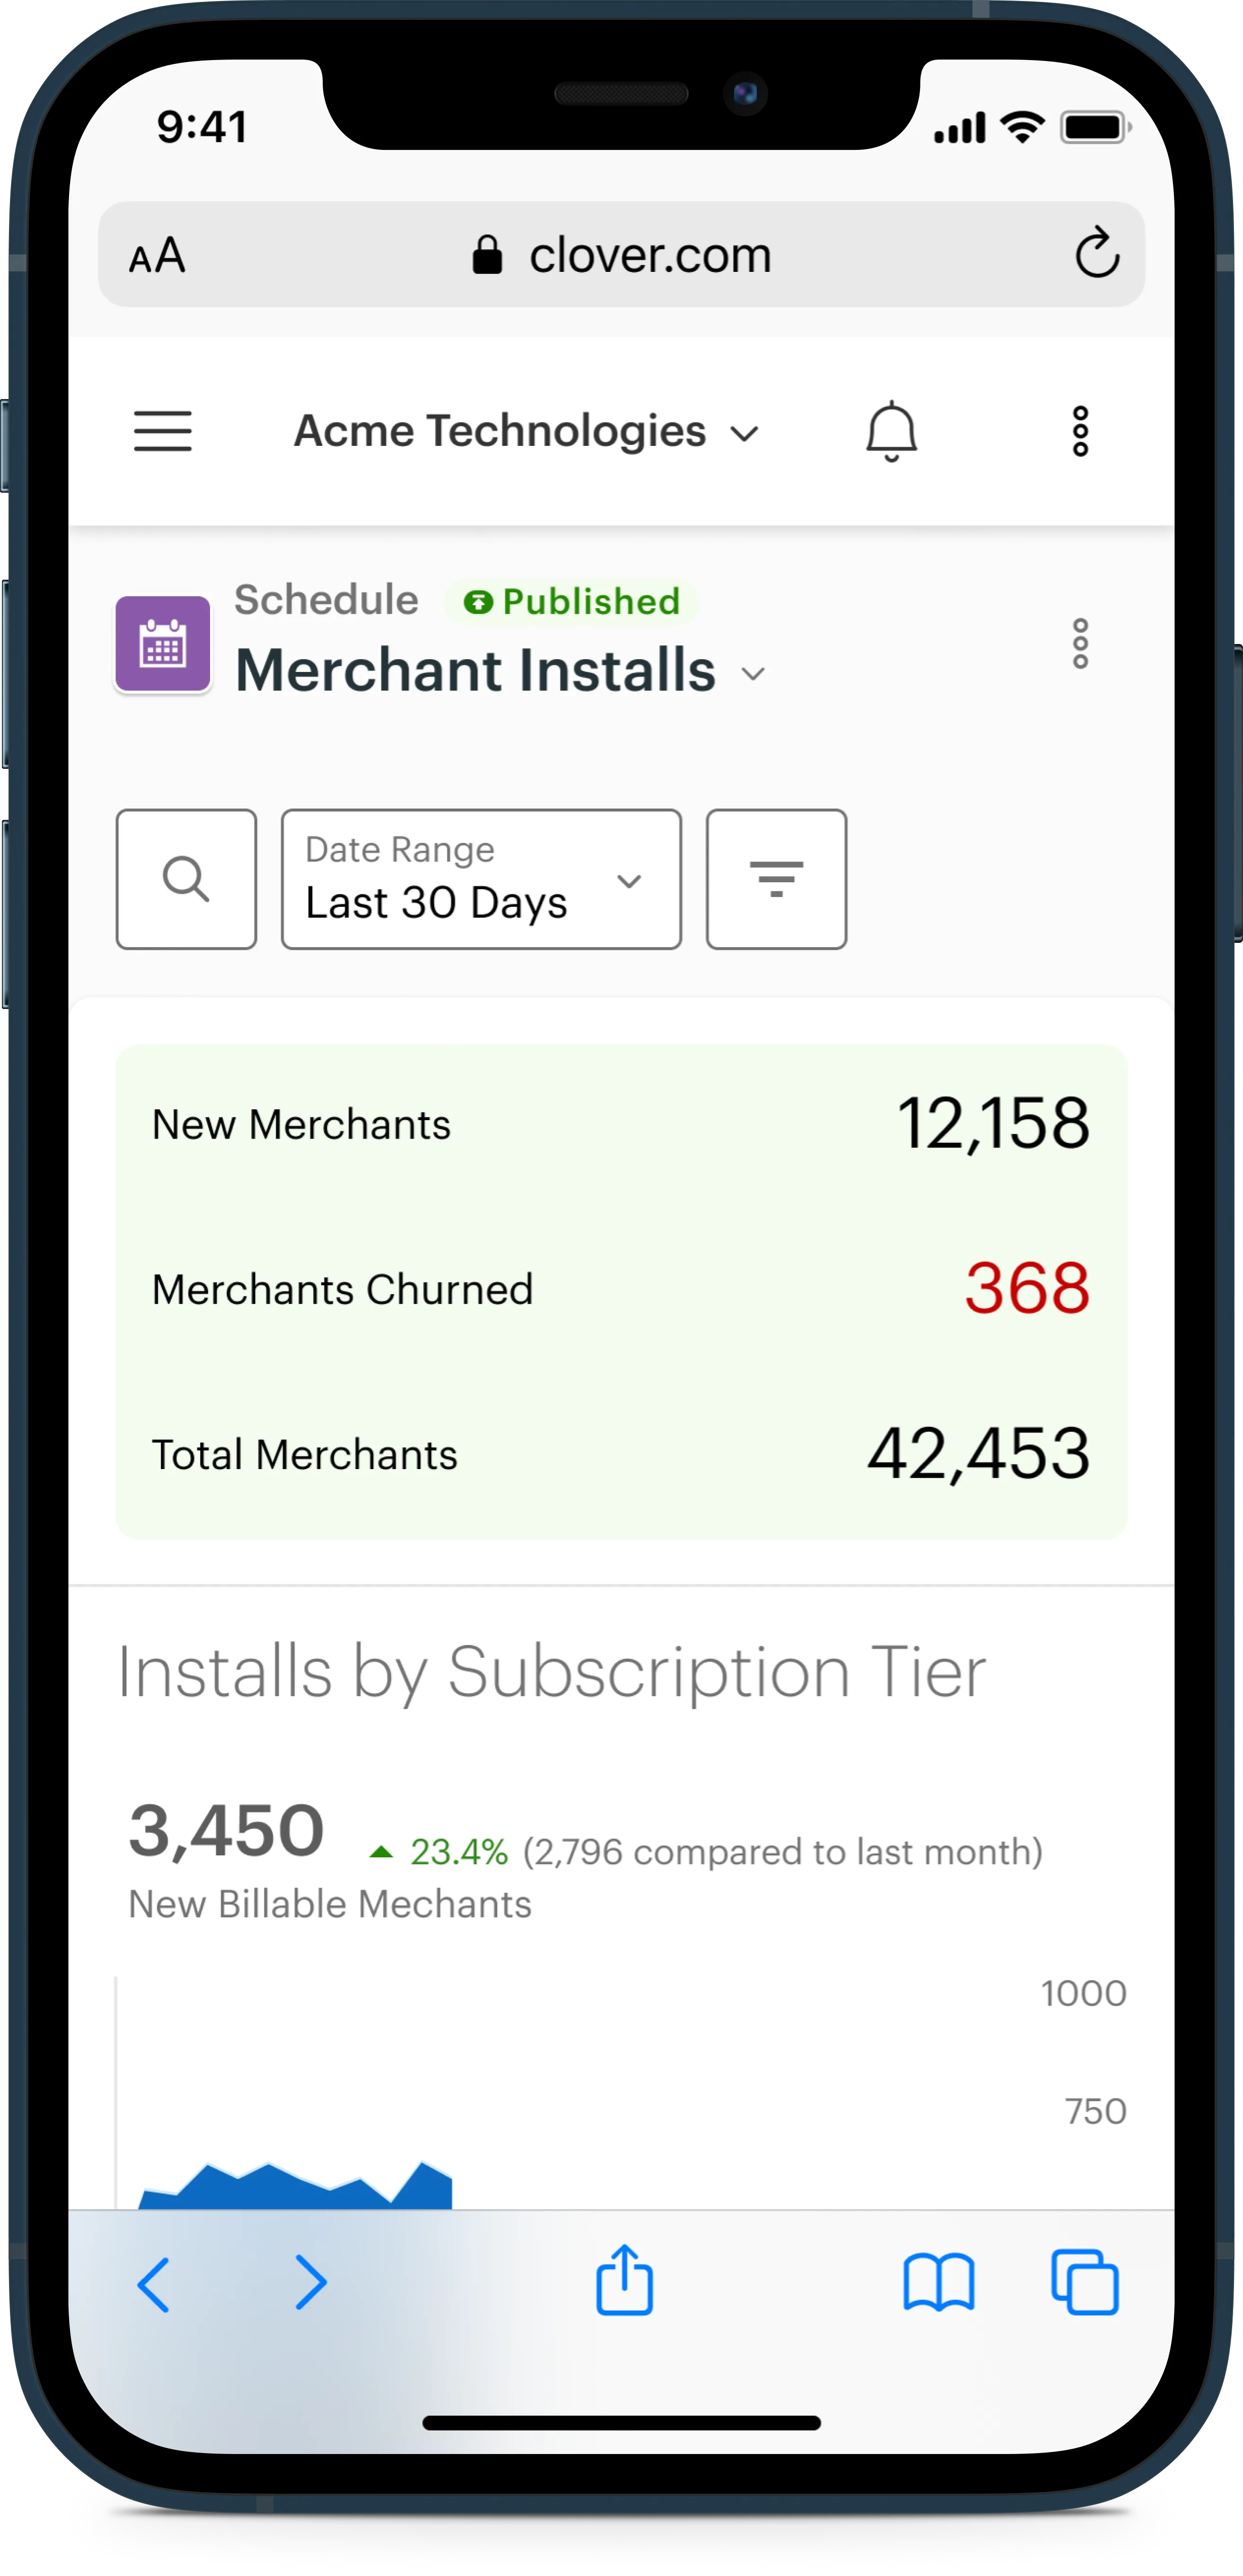
Developers are unable to get basic metrics around how their apps are performing, making it hard for them to understand how to market their apps and which apps to focus on improving.

Opportunity

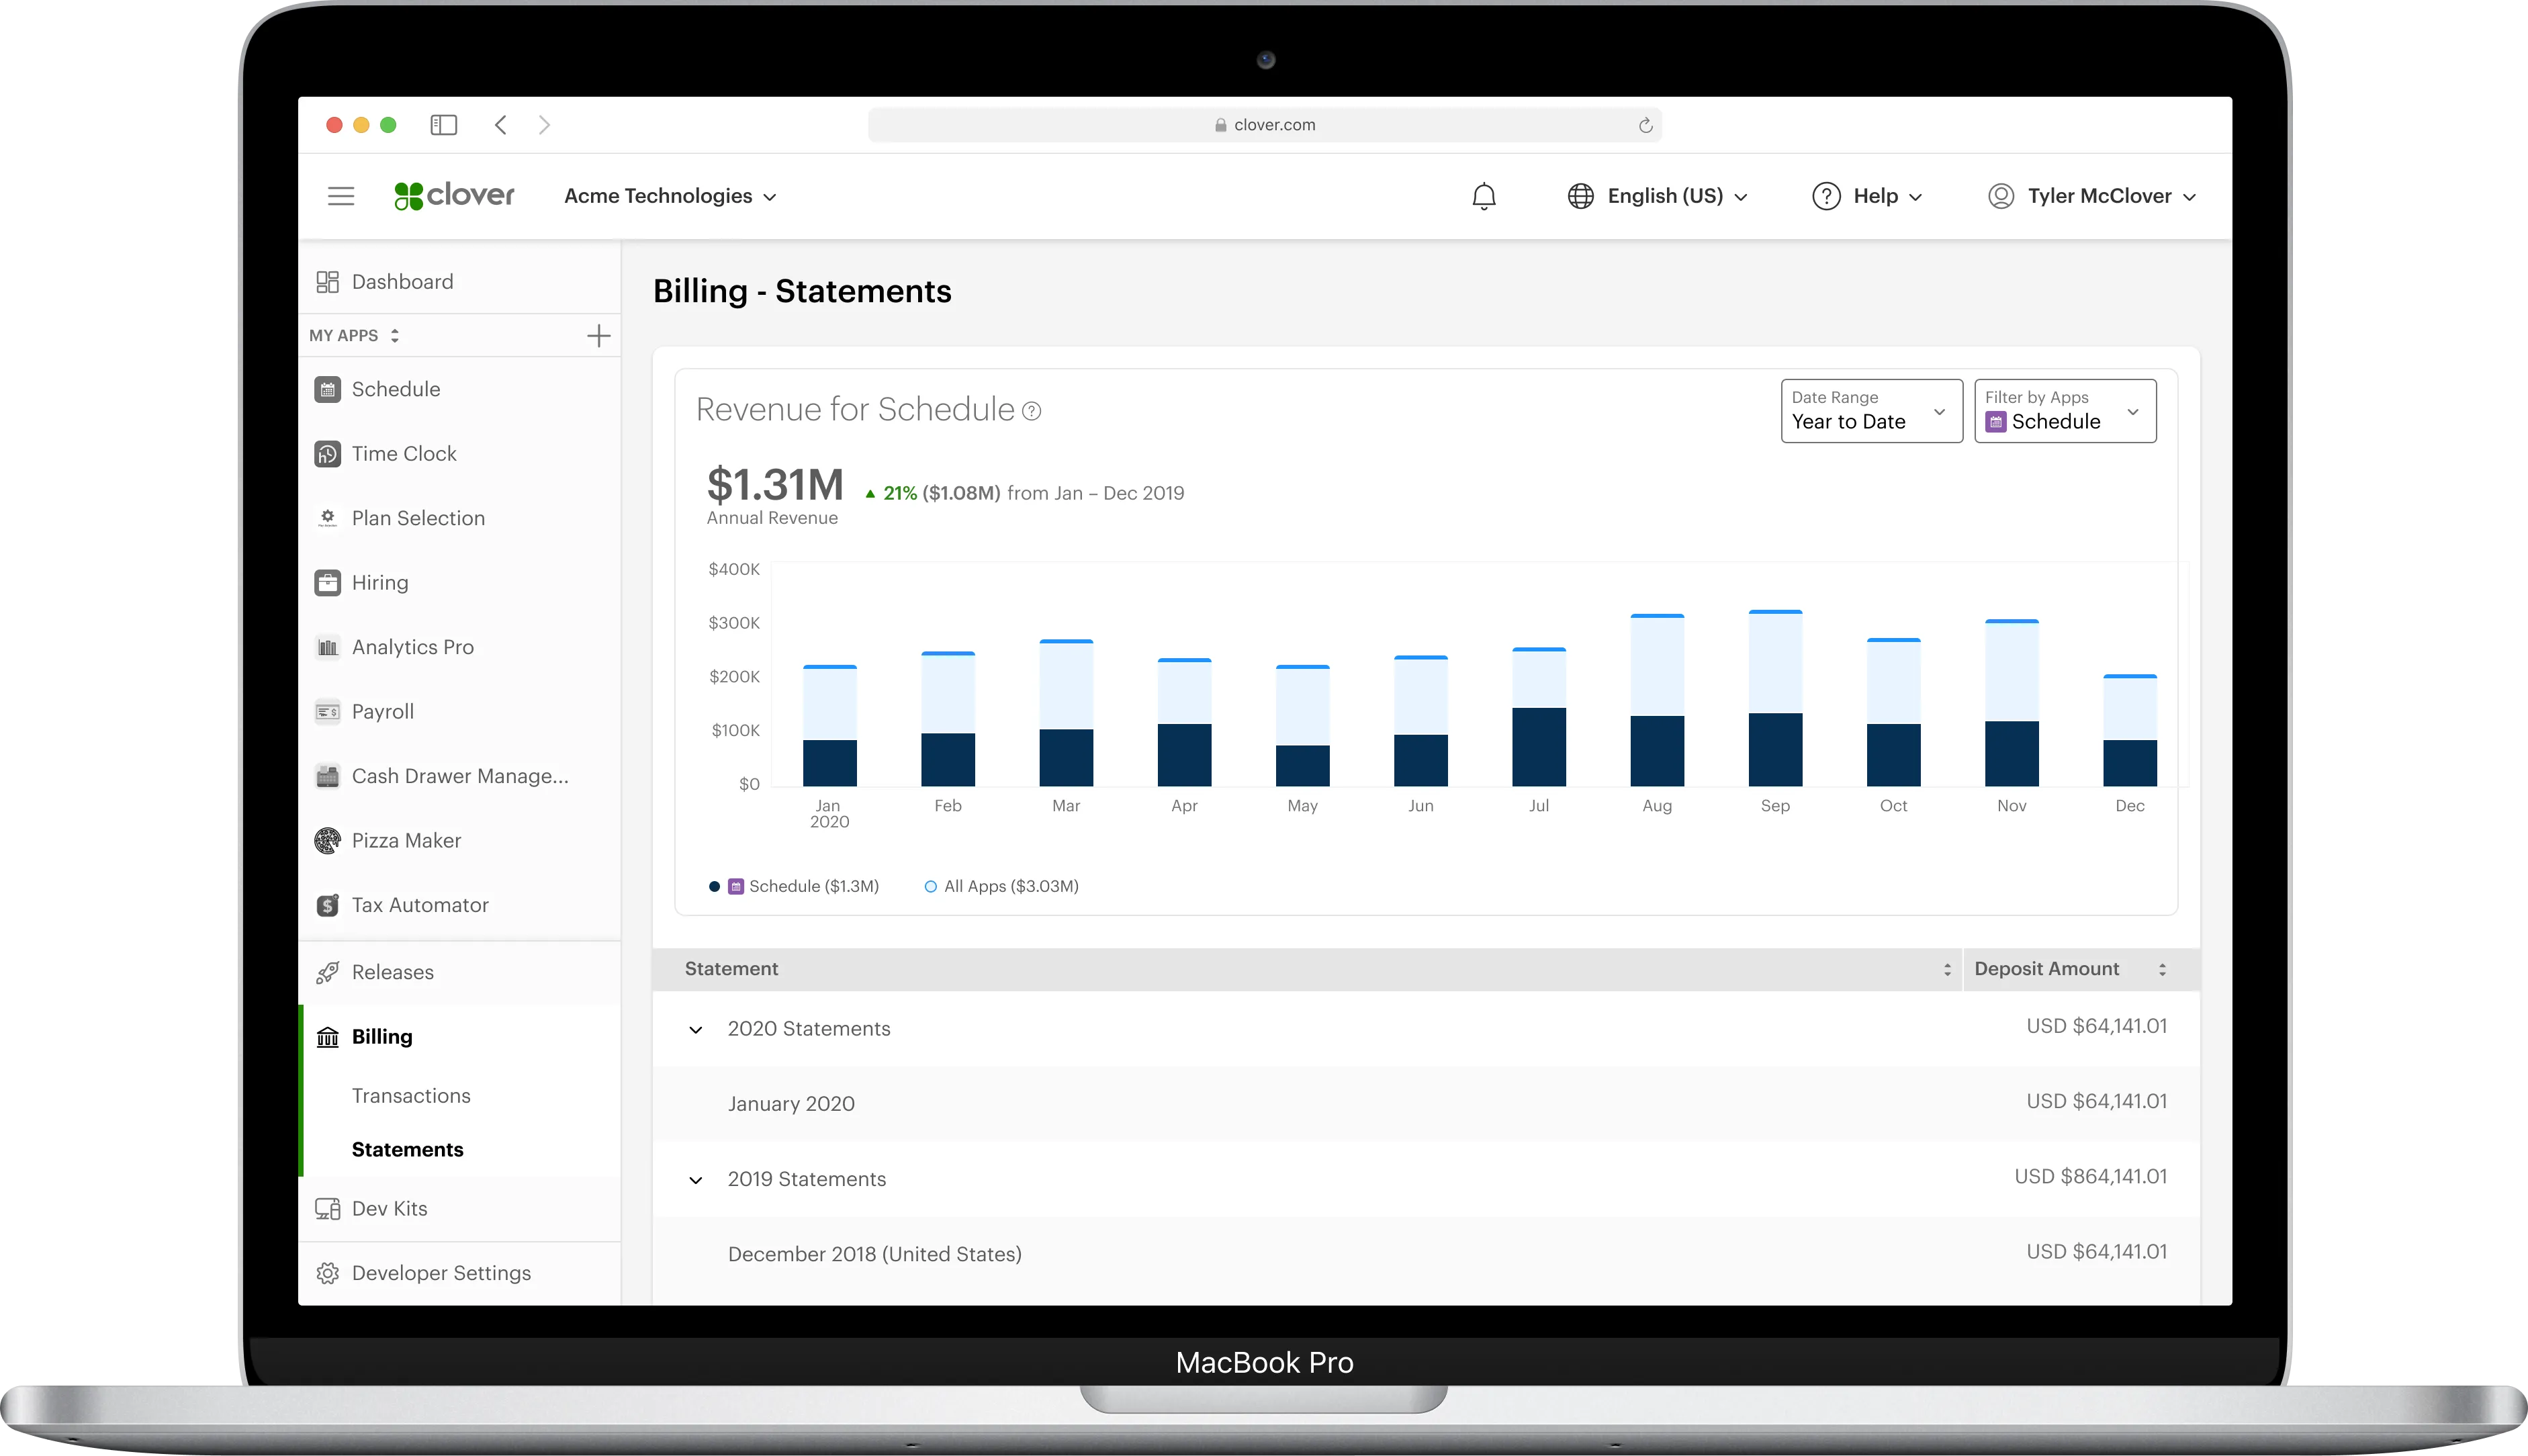
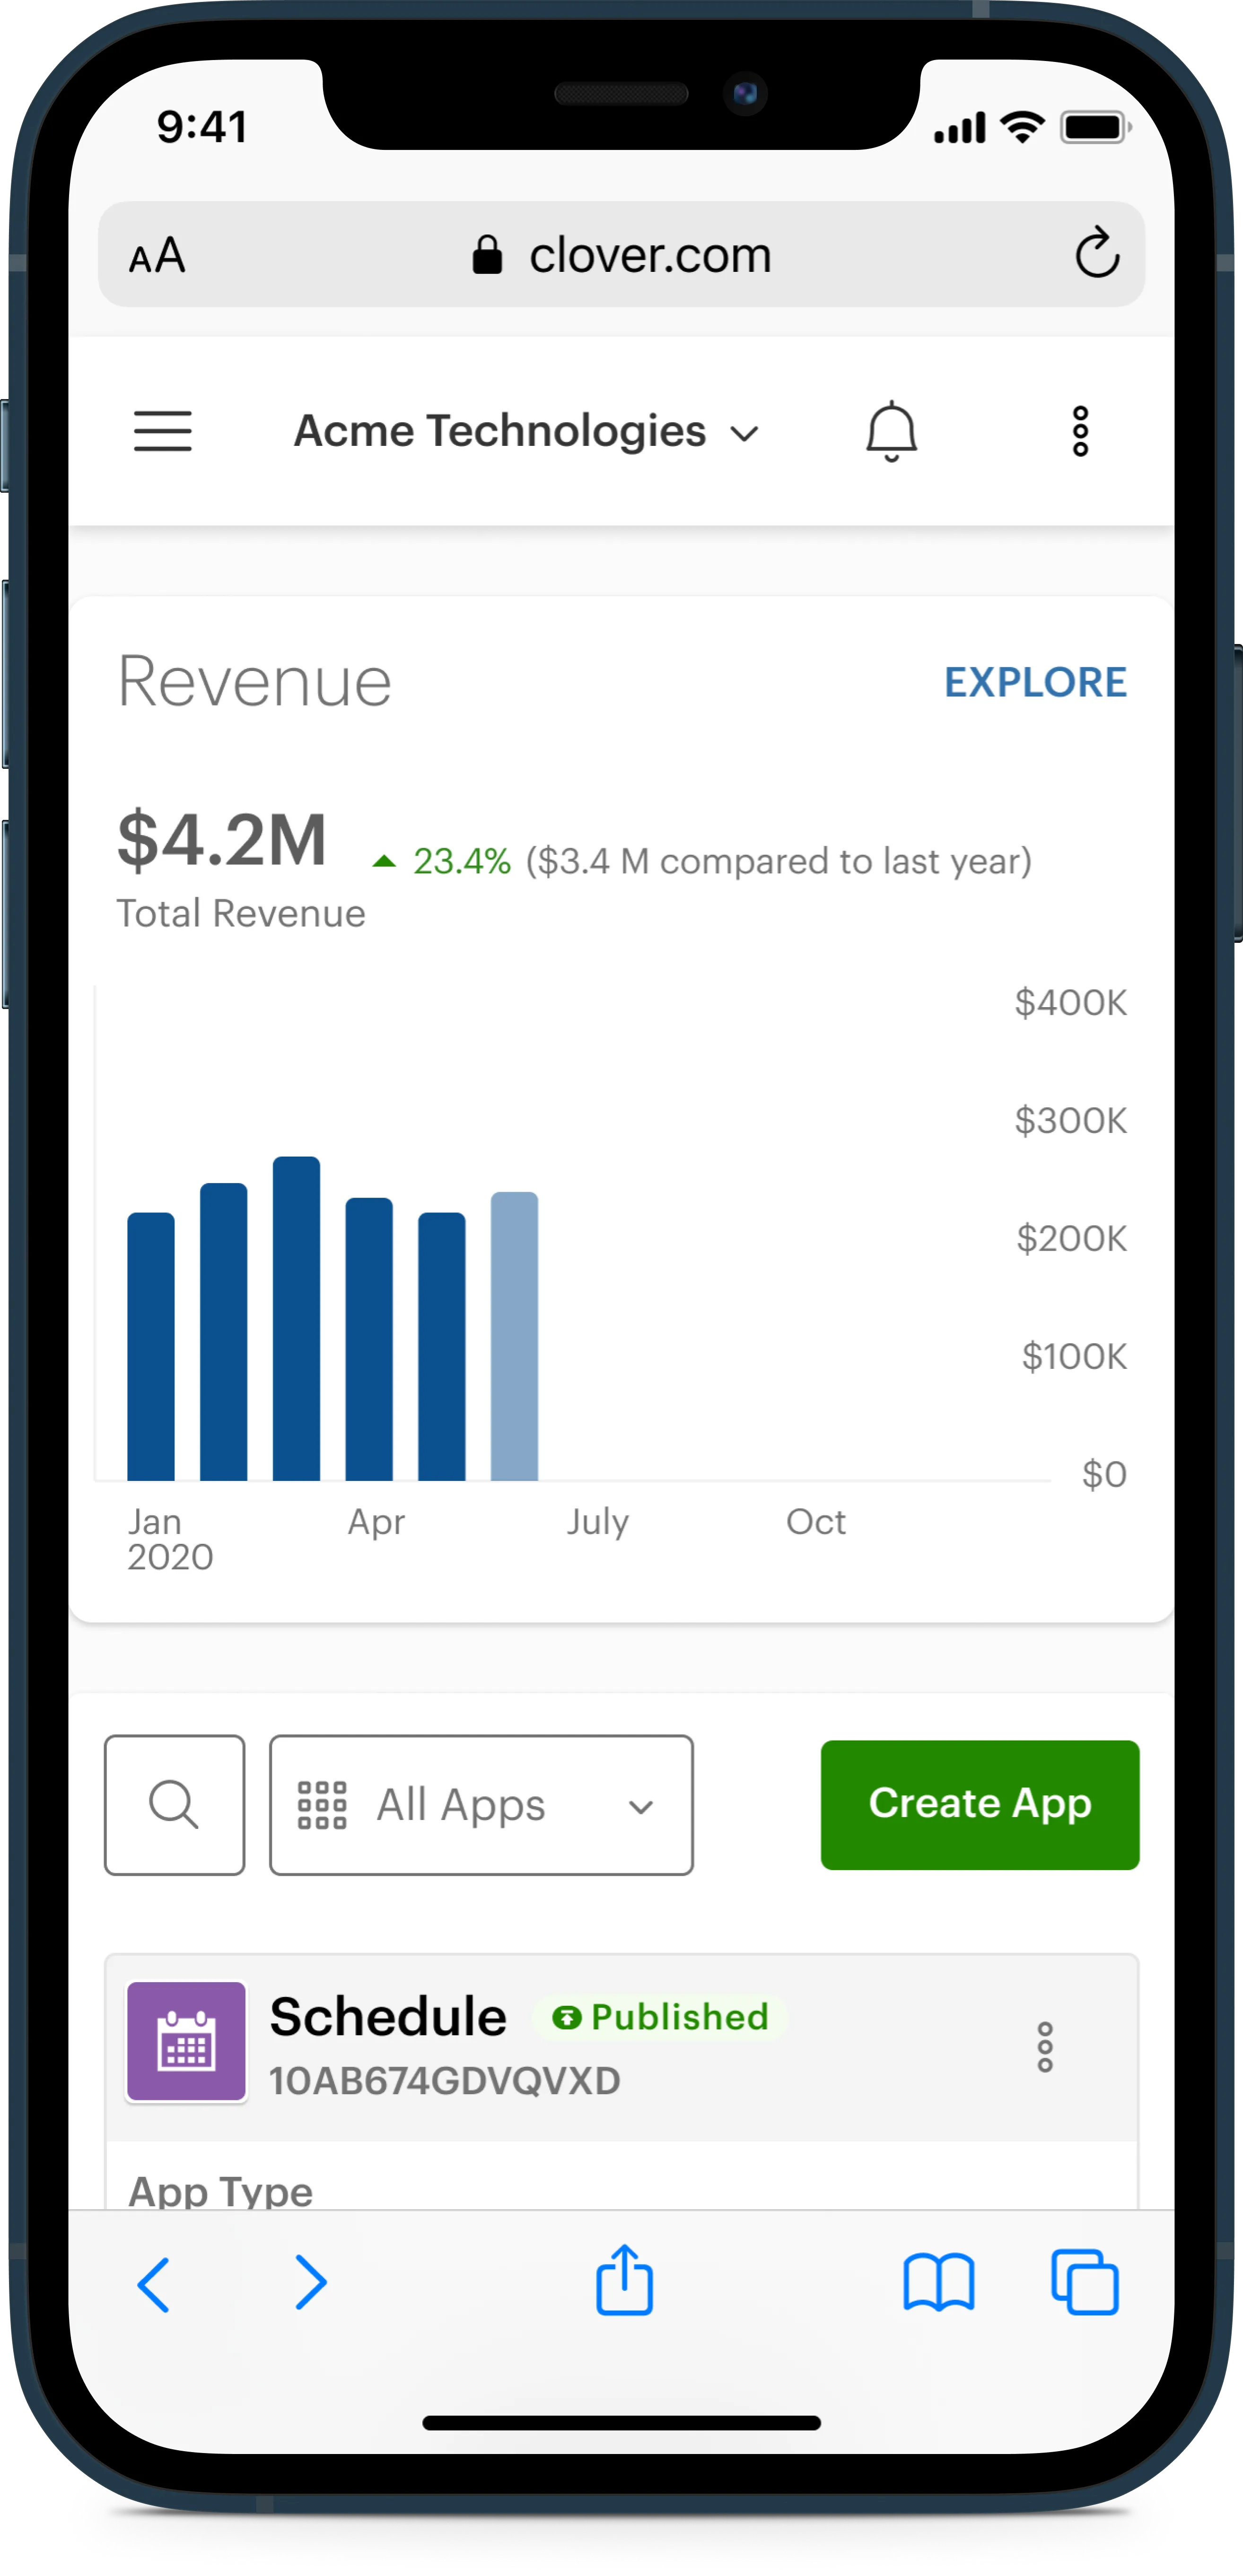
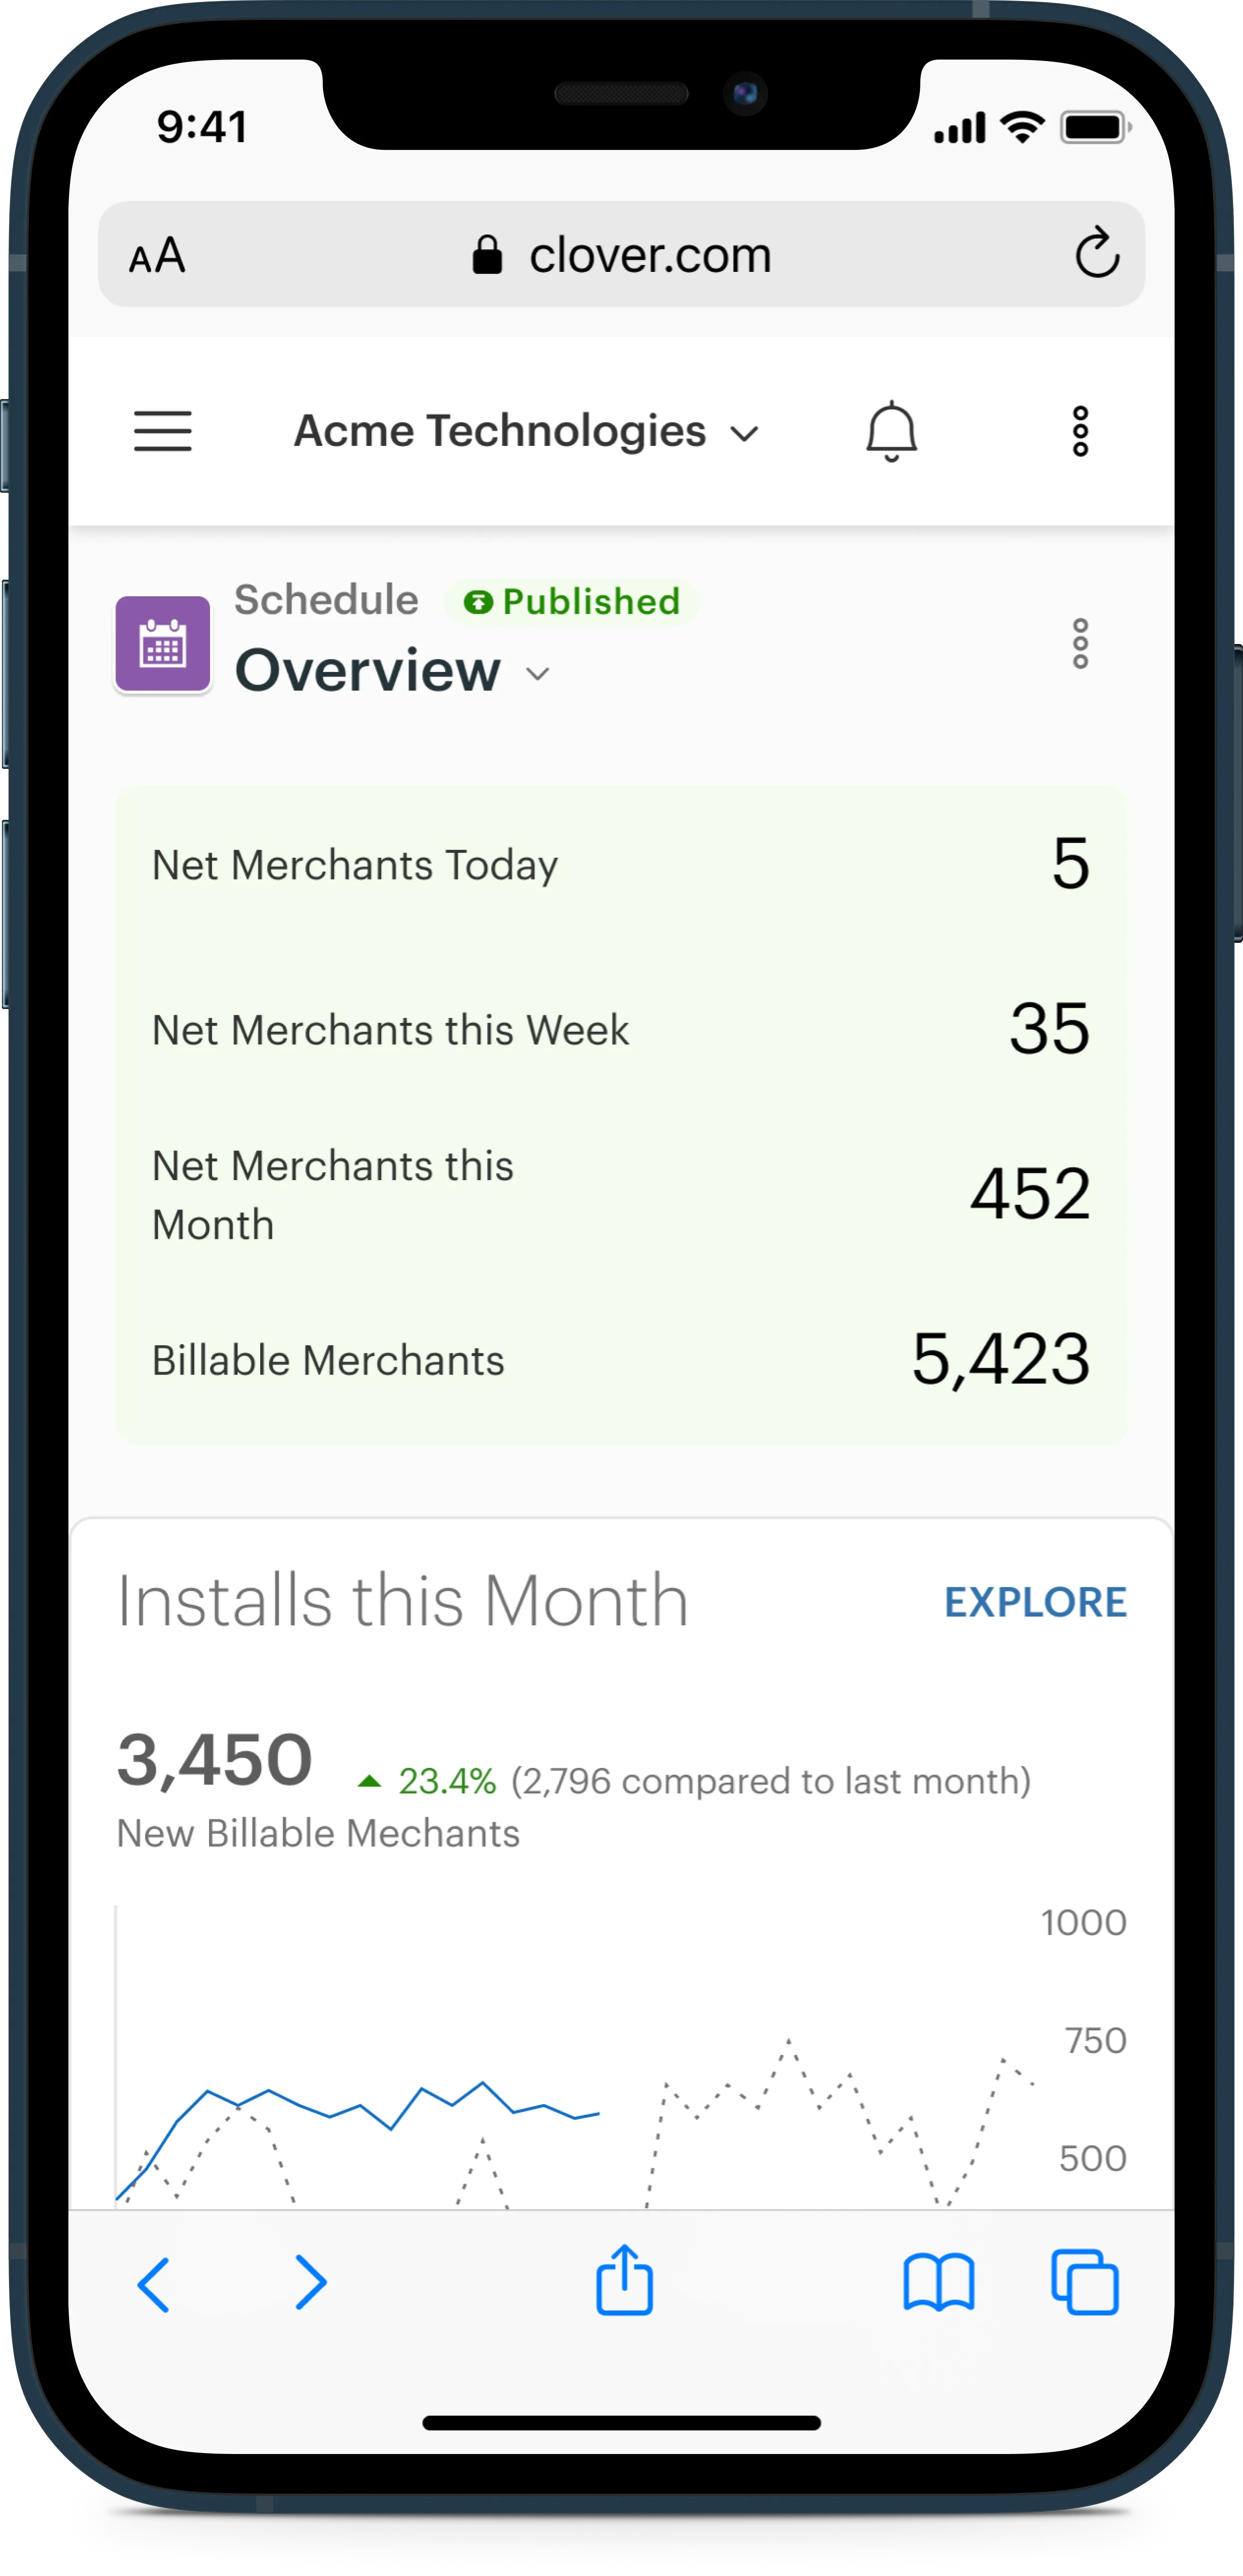
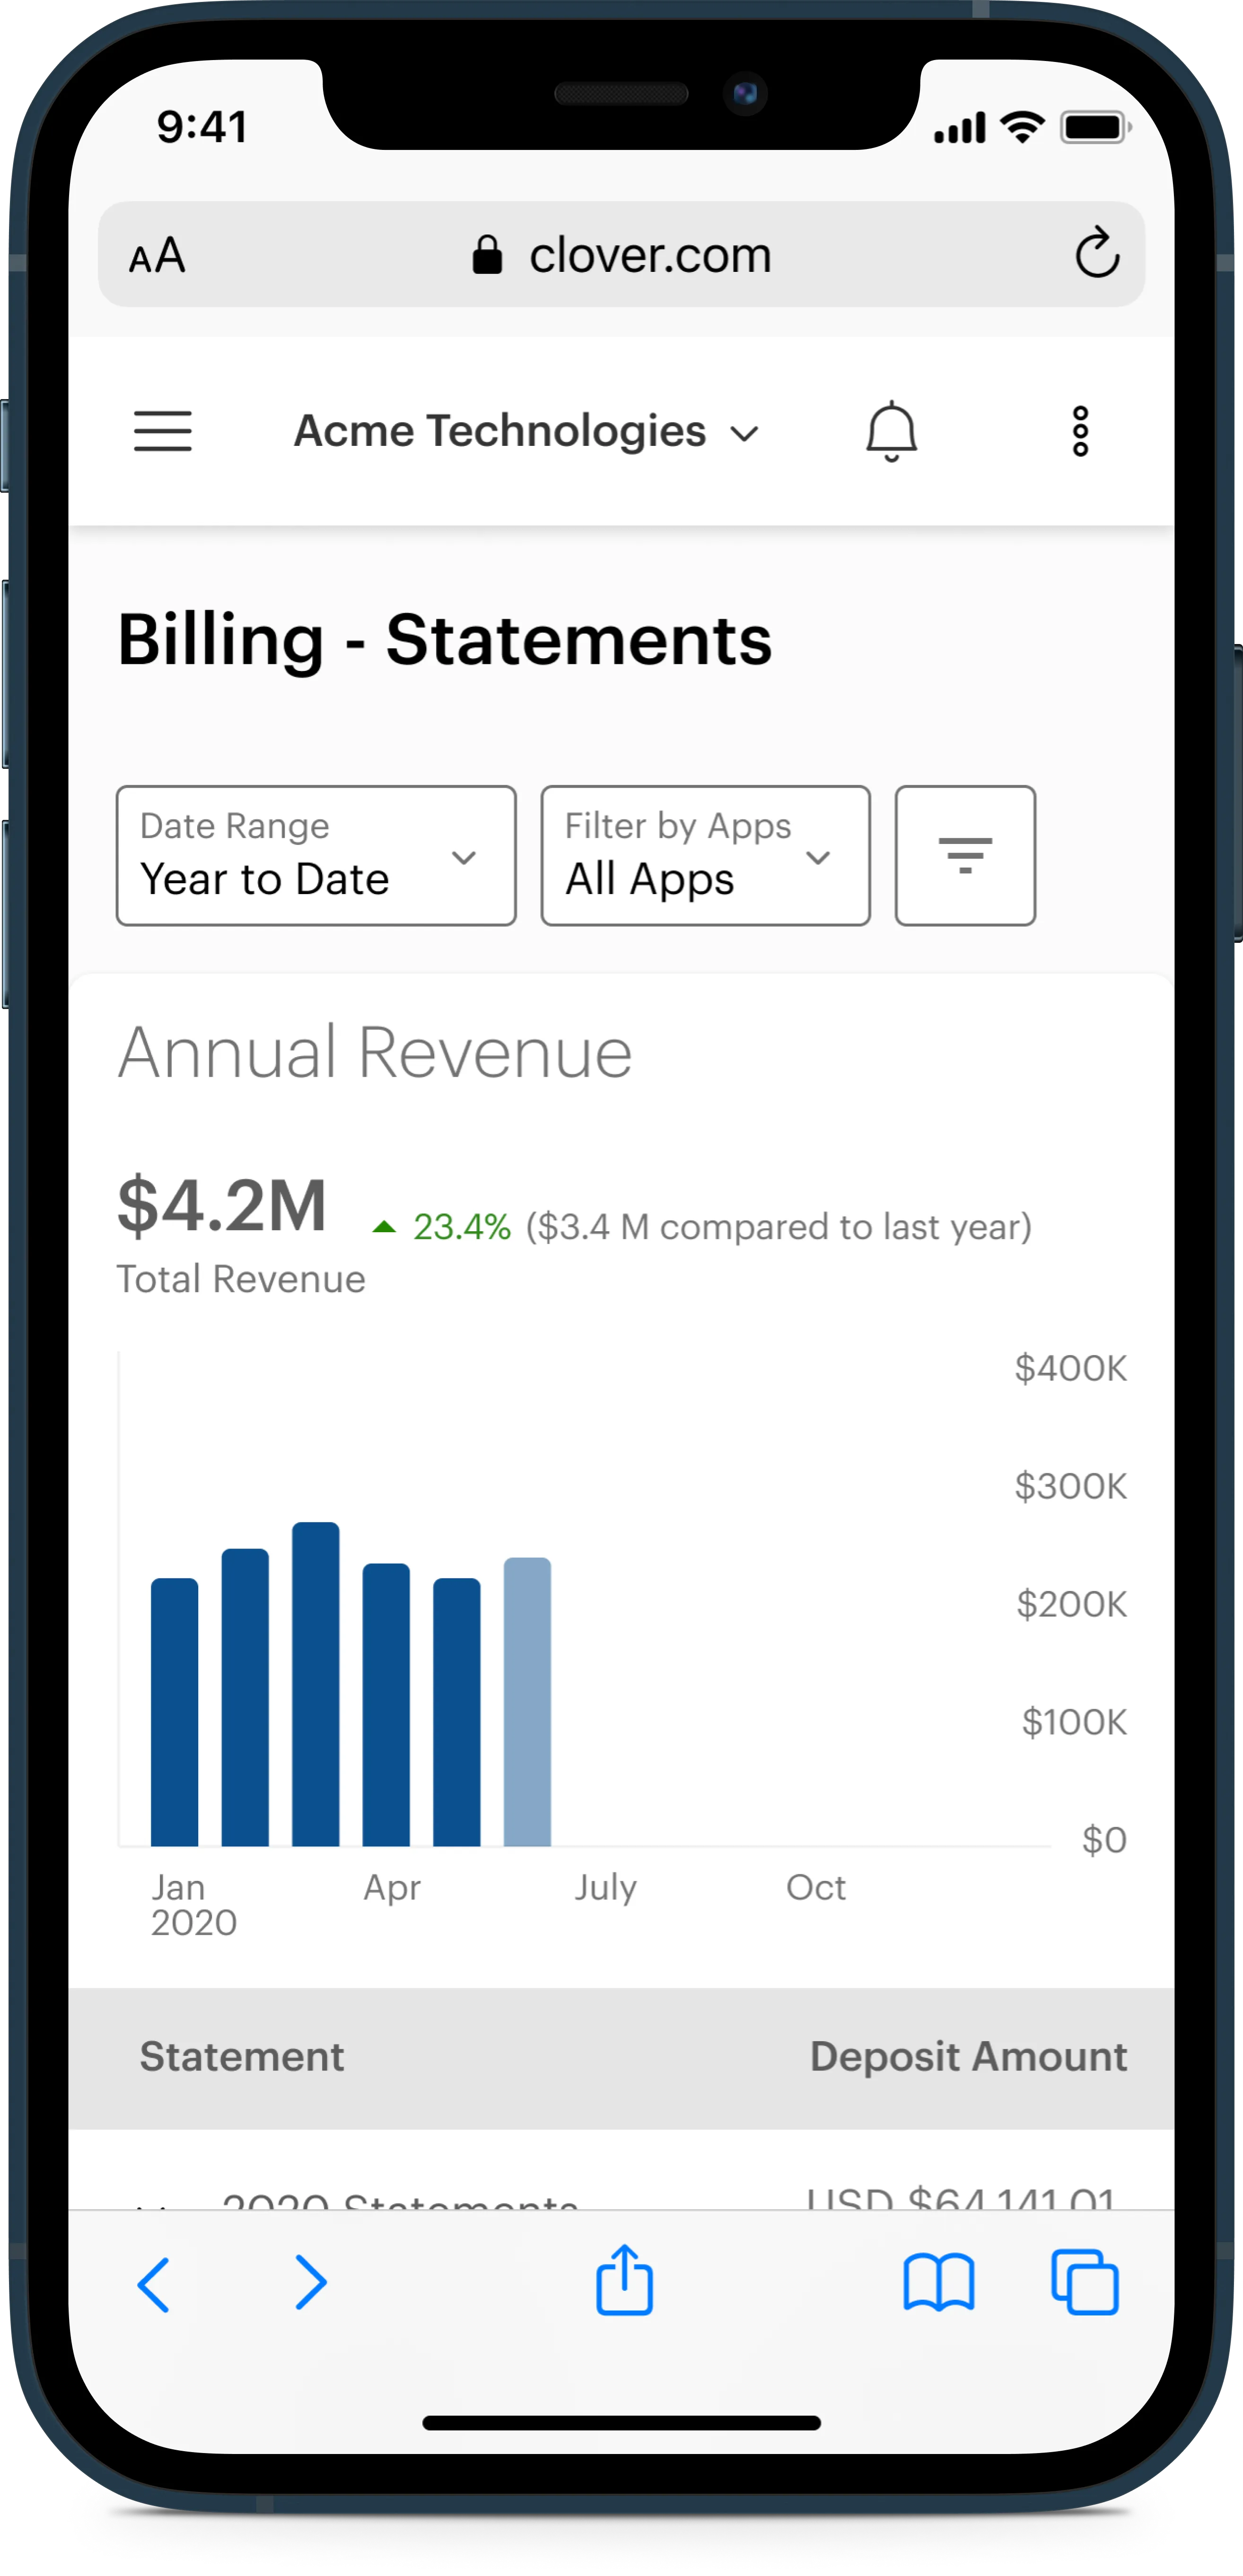
We can provide developers with the ability to track their apps are performing in terms of installs and revenue.

Grid of iPhones and Browsers showing screens from Developer App Metrics project

Solution

Provide developers with install, uninstall, and revenue metrics that can be monitored at-a-glance or analyzed by applying filters to the data.
Create interaction patterns for metric widgets that can be applied to other metrics on a later roadmap and to other products for developers and merchants.
Scenario 1
View App Overview Metrics & Filter Installs
Scenario 2
View App Metrics on your phone

Impact

We defined success by increases in page engagement (8% increase), session time (12% increase) and customer satisfaction.
We surveyed developers and they reported a 3.8/5 customer satisfaction rating, meaning we covered much of their desired metrics while recognizing room to improve in time and precision of metrics to present.

Role

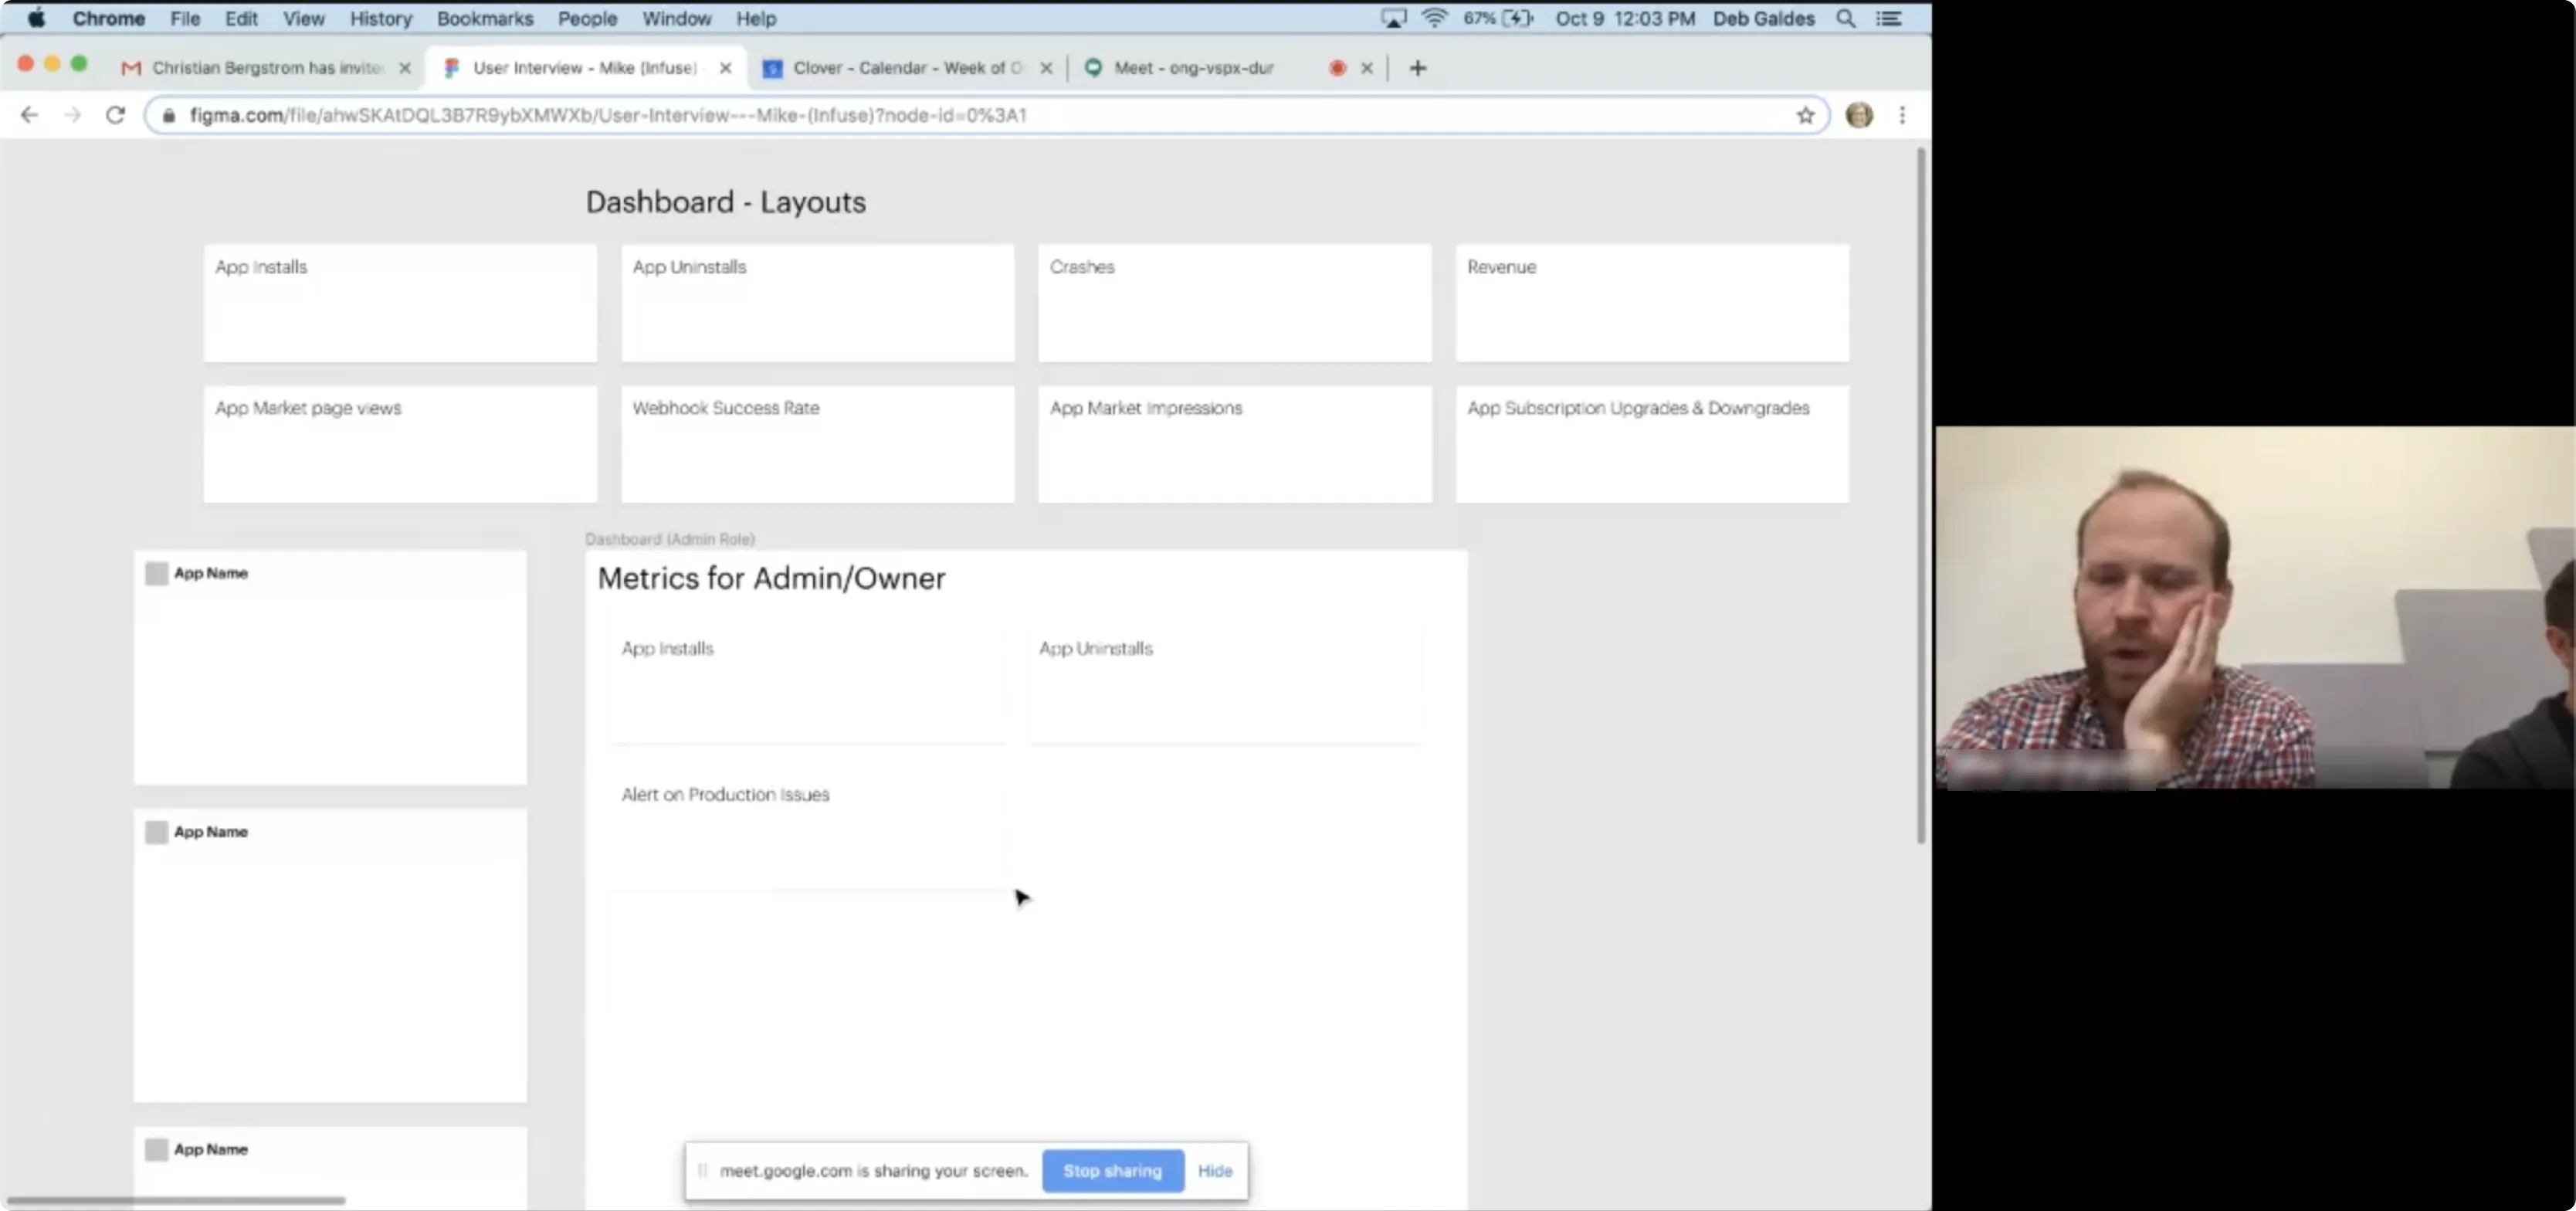
I lead research, definition, and design of the metrics we would support and designed a component-based system for displaying our metrics.

Team

I collaborated with a Product Manager to prioritize the metrics, Senior User Researcher to understand which metrics were most important and how they would impact developers’ tasks, several front-end and back-end engineers to implement the metrics at a high quality execution.


Process

Empathy Interviews

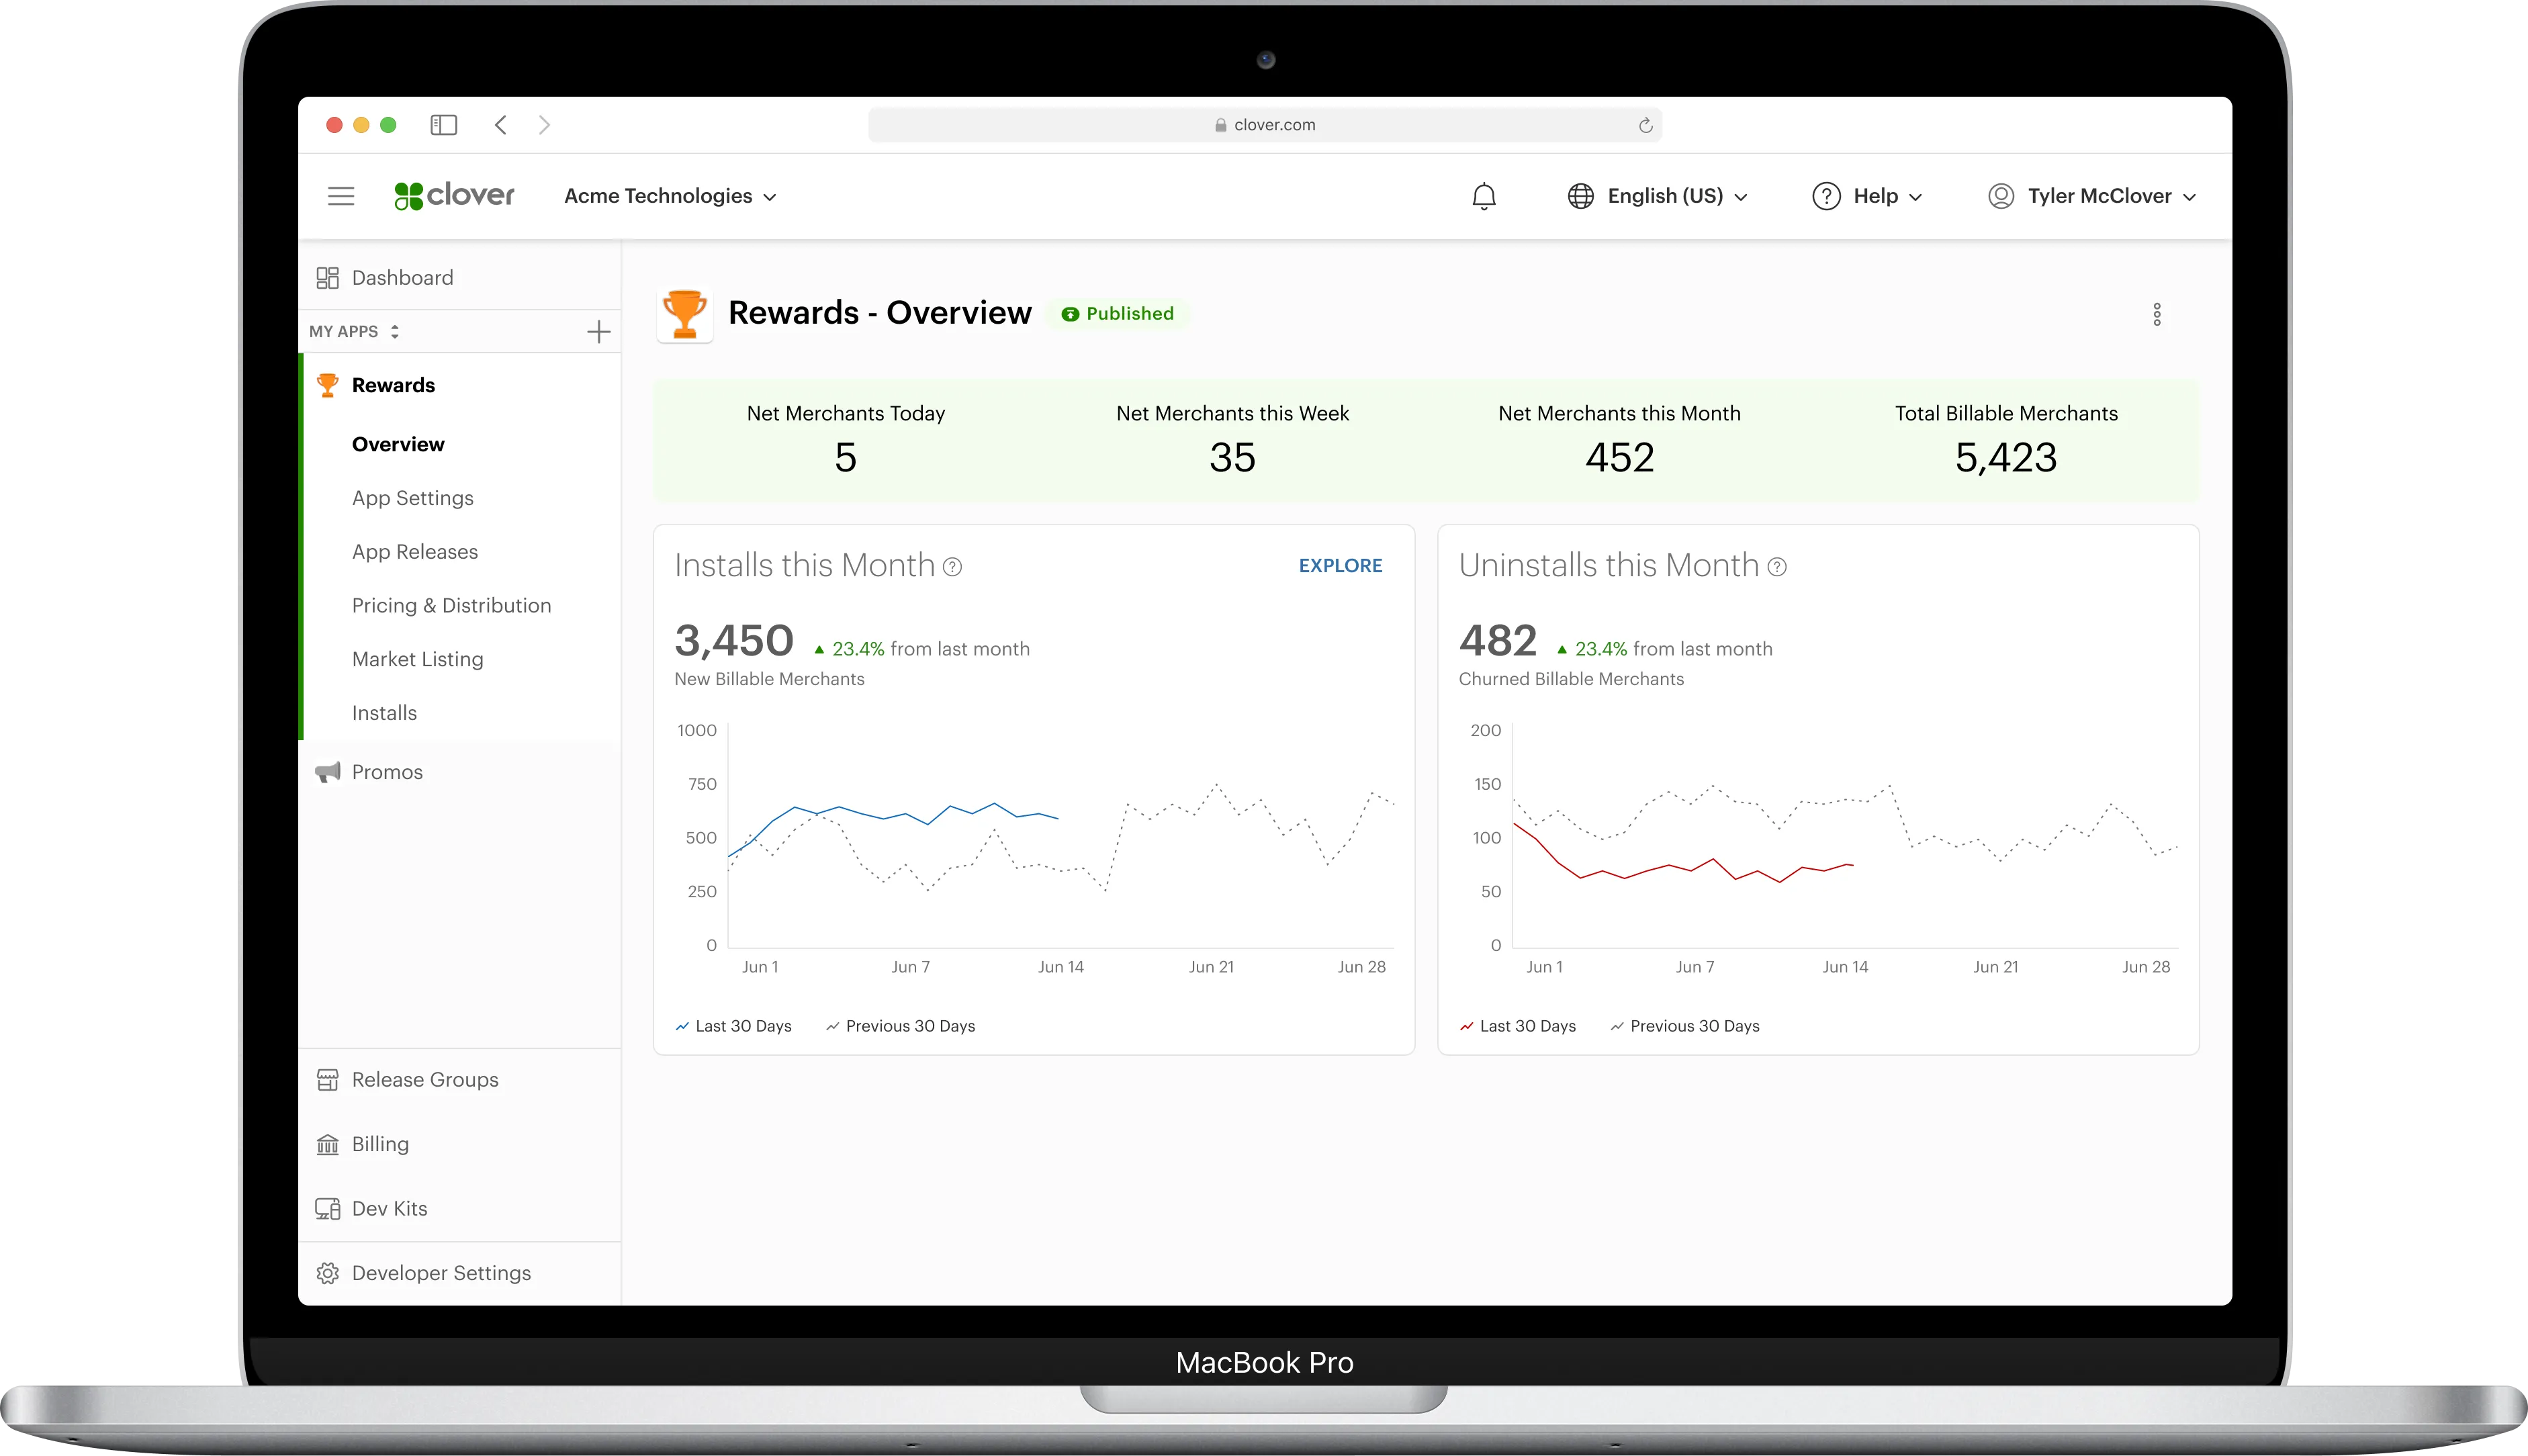
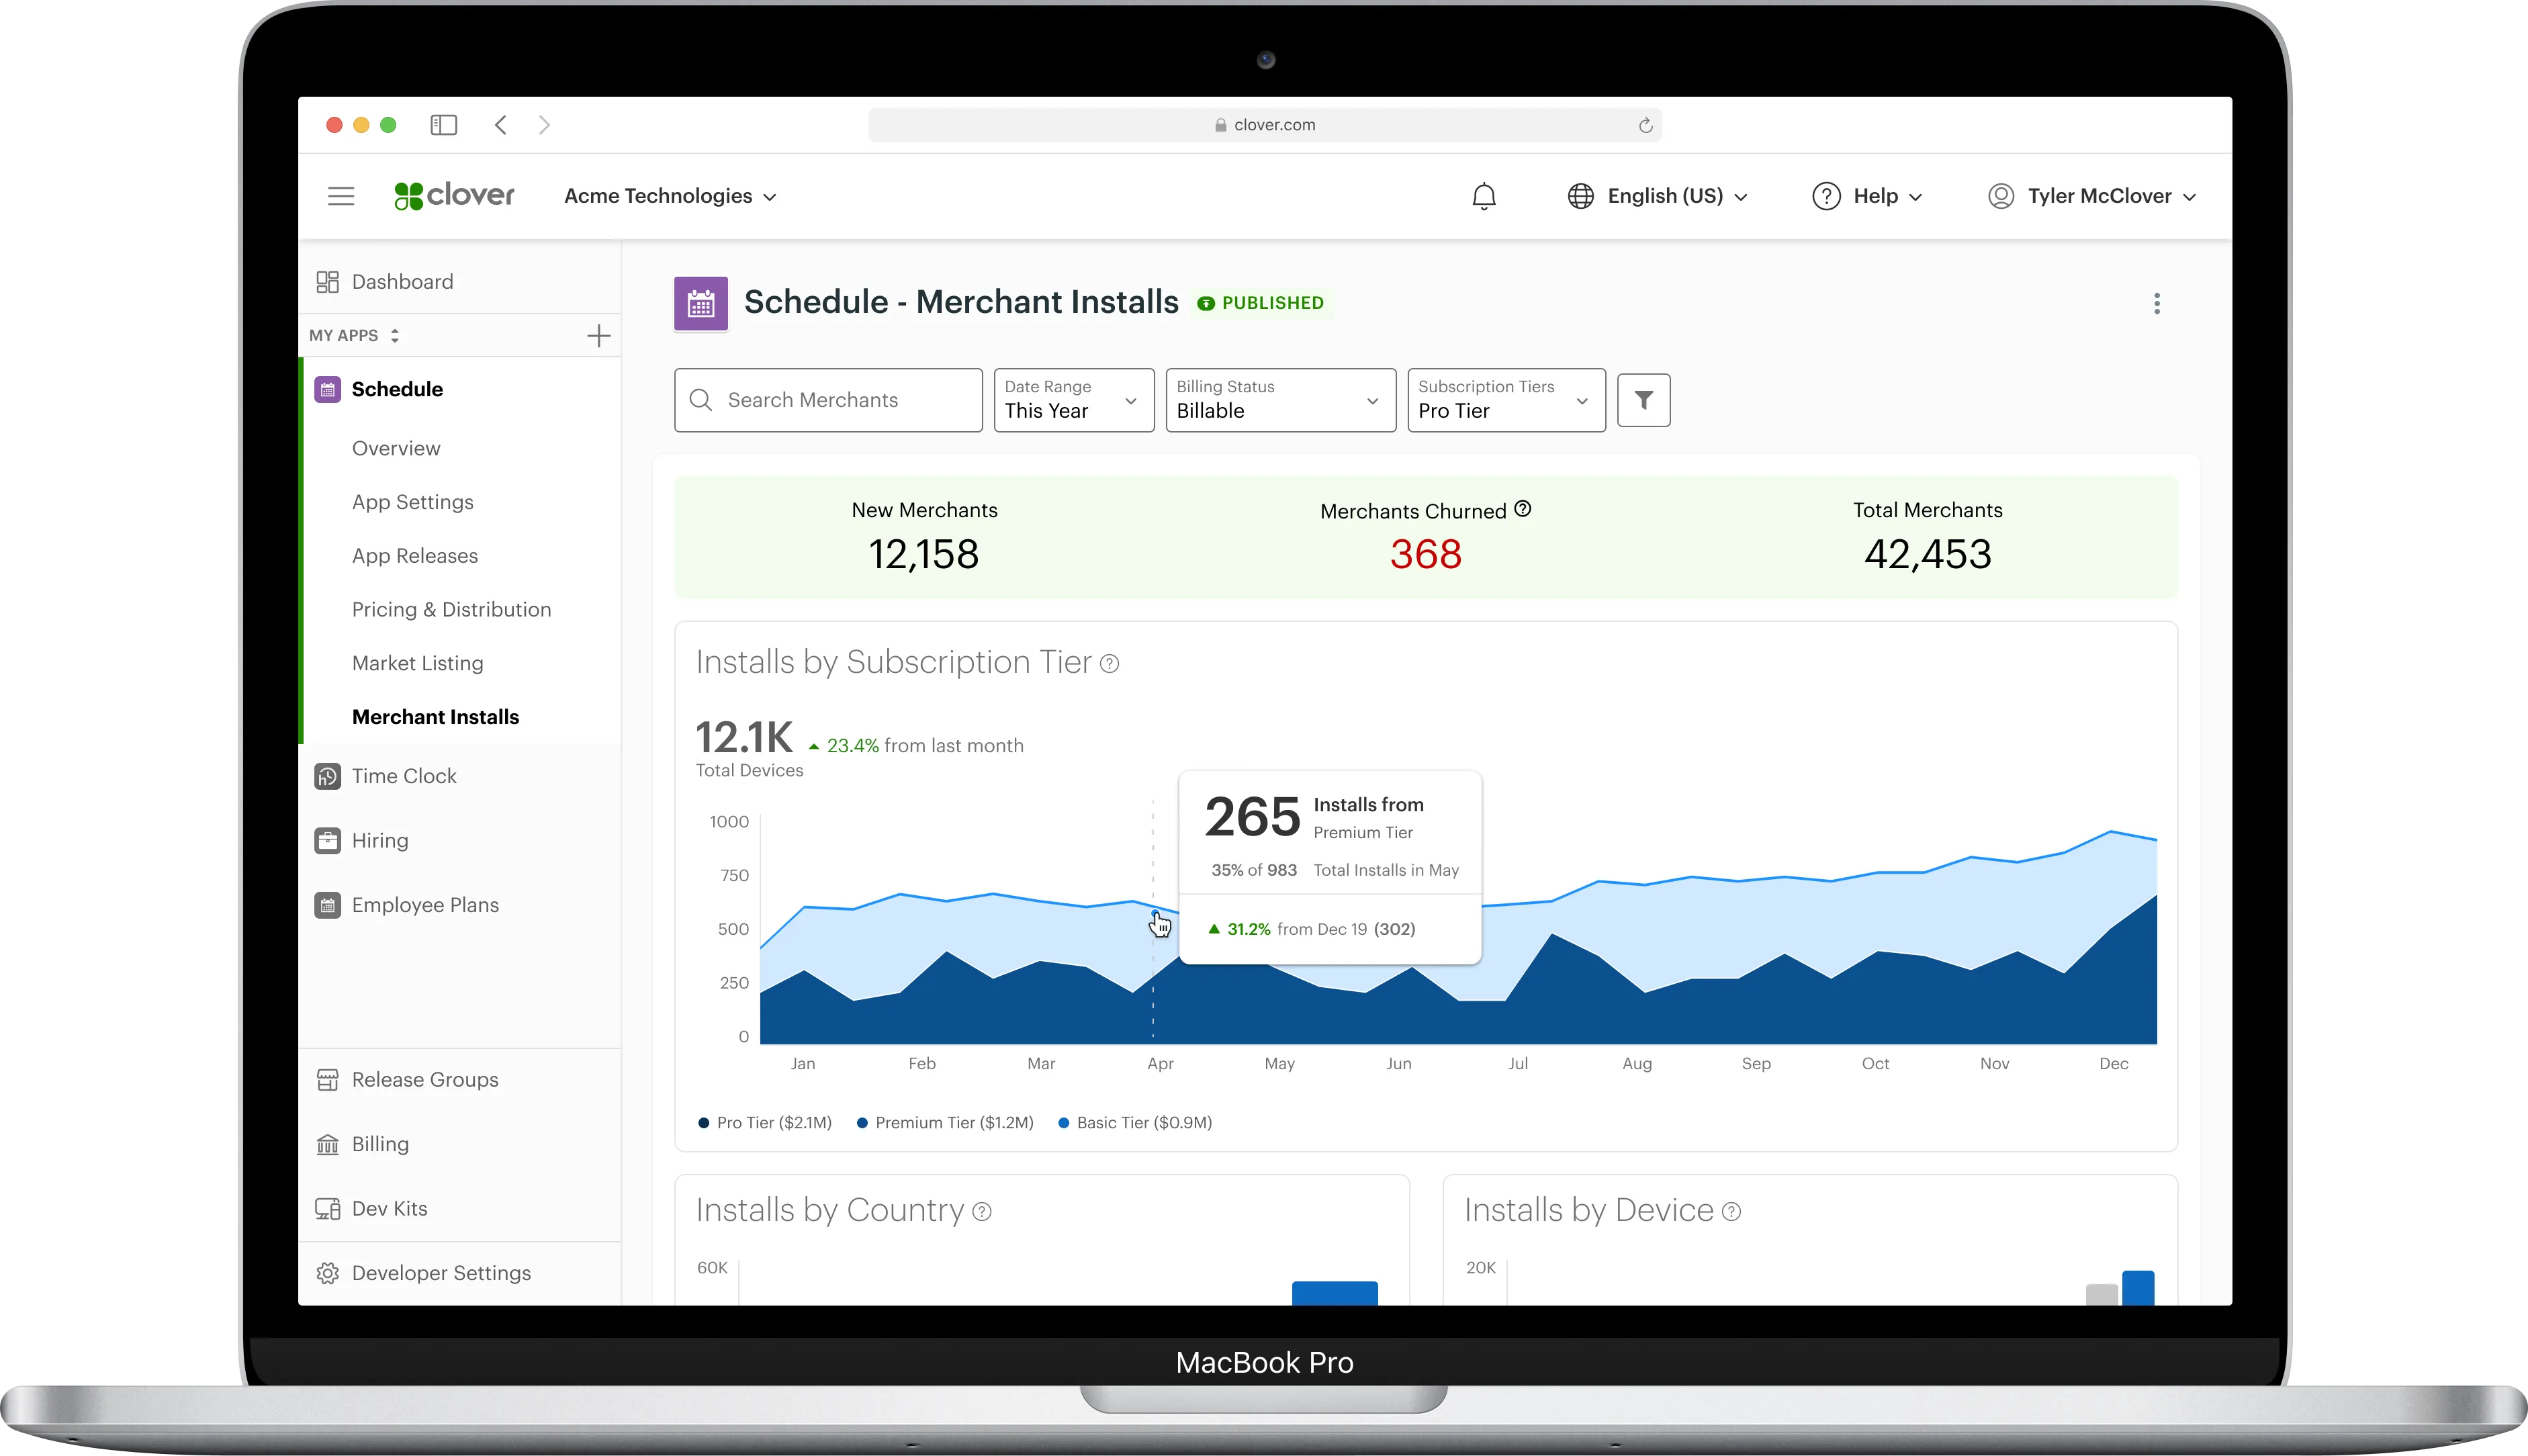
Starting off with empathy interviews helped define the scope of what metrics would be most impactful for developers.We discovered through research that installs, uninstalls, and revenue metrics were most important for business performance.

Empathy Interviews with Developers helped us understand their priorities

Research as a Team Sport

We involved engineers and stakeholders in our empathy interview sessions. One of the engineers remarked that they discovered from the empathy interviews that the metrics have to tell a cohesive story about your app.

Flavor & Size Whiteboard Concept Exploration

Usability Testing

Conducting usability testing with developers helped us find and address bugs and validate our initial direction in app met.

Developer App Metrics

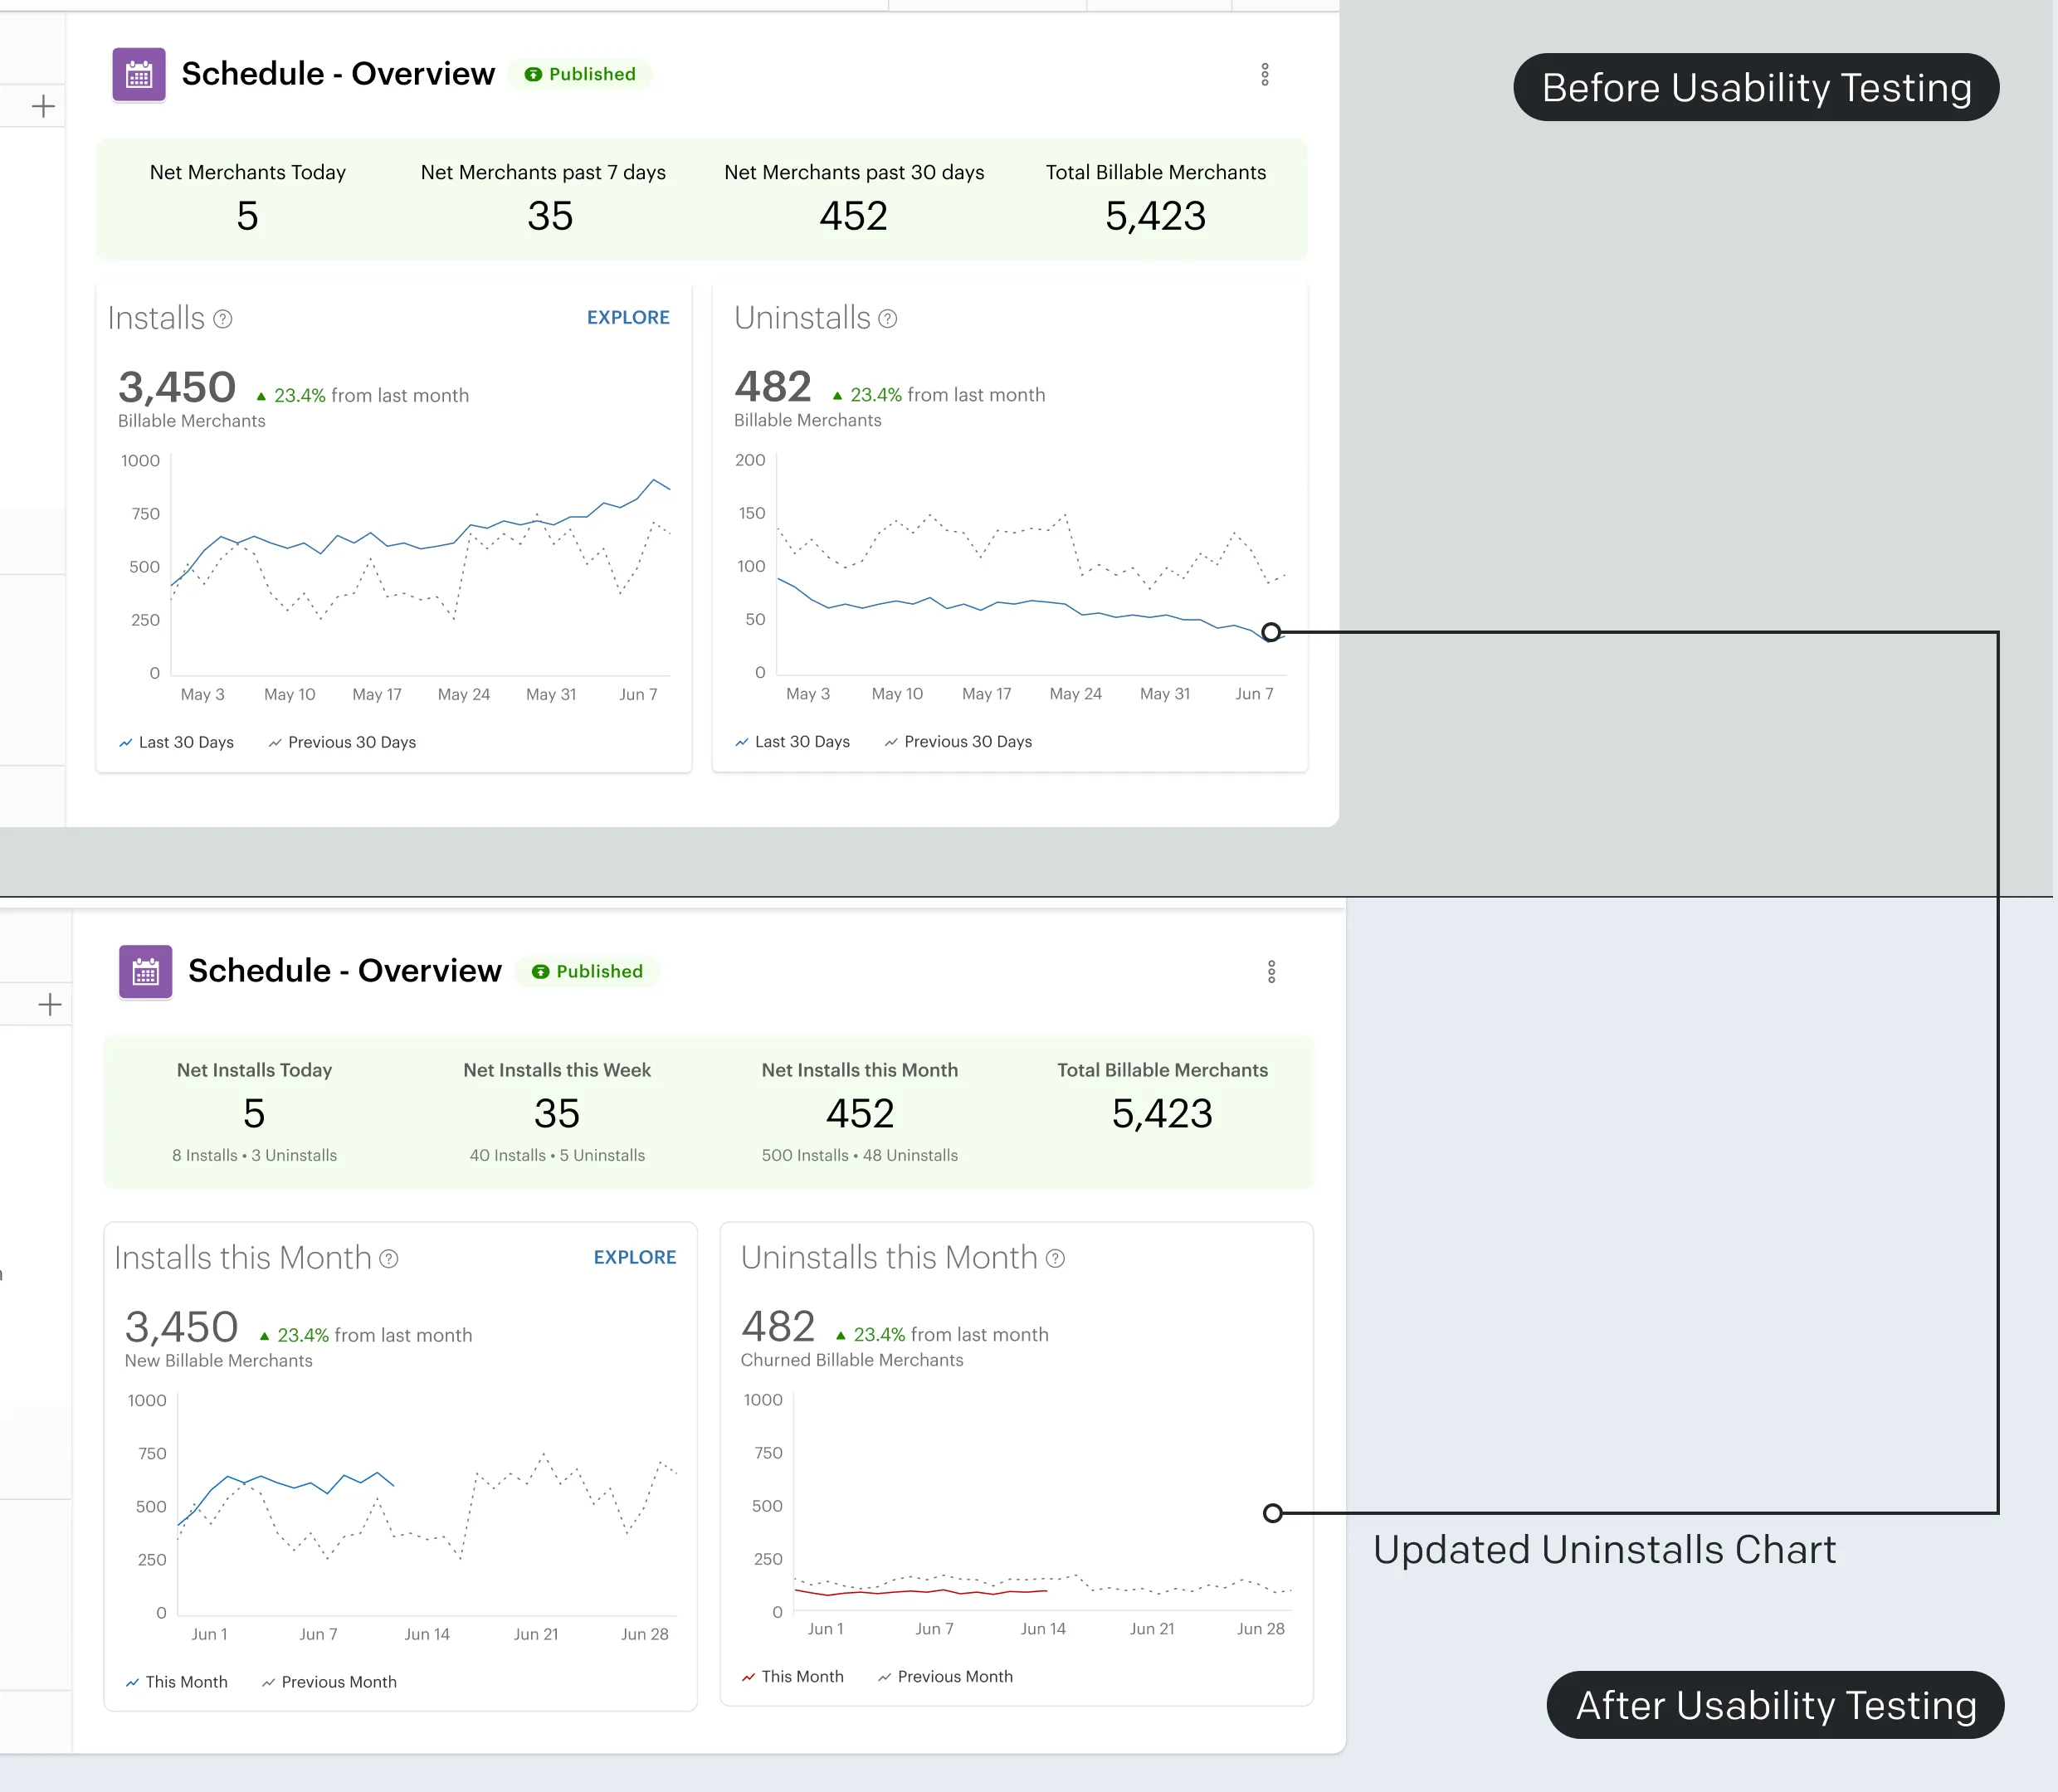
Applying Usability Feedback

The usability participants provided feedback that we should present installs & uninstalls with the same y-axis and differentiate the colors to communicate the negative correlation between how they would feel seeing installs and uninstalls at-a-glance.

Developer App Metrics Overview comparison before & after usability testing feedback